
Instant Ramen Nutrition: What Ramen Nutrition Records Tell Us
October 16, 2026
Instant Ramen Nutrition: What Ramen Nutrition Records Tell Us How do calories, sodium, fat, and protein compare when every product is measured per 100g? We analyzed NoodleIndex…
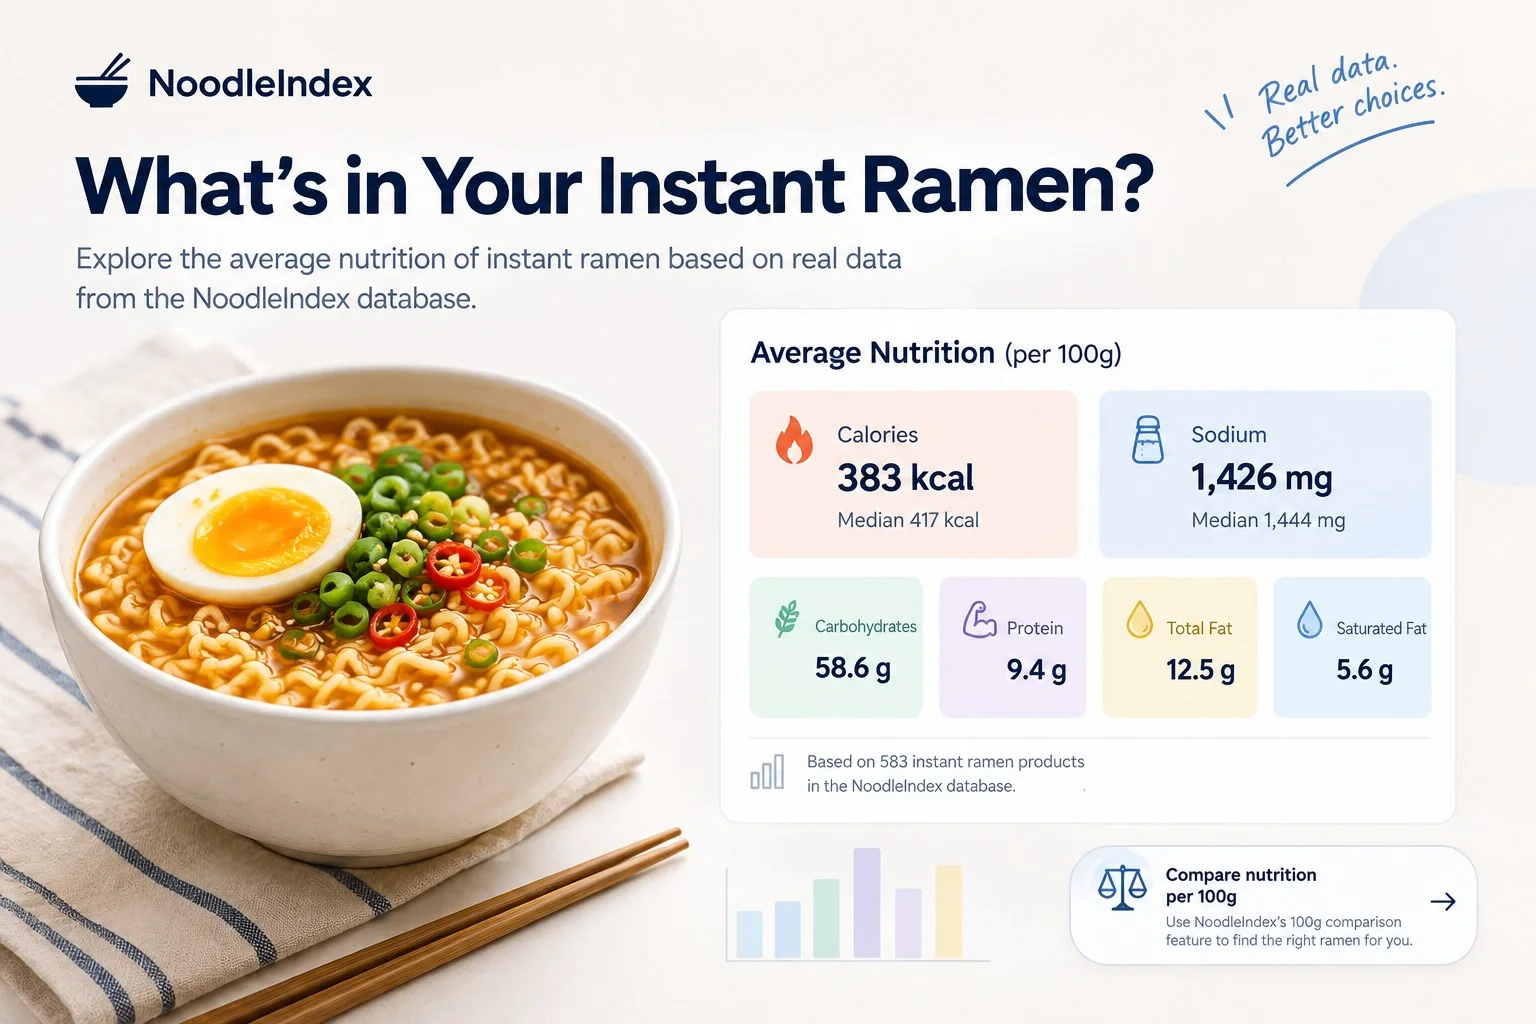
How do calories, sodium, fat, and protein compare when every product is measured per 100g? We analyzed NoodleIndex nutrition data to find out.
Instant ramen comes in many package sizes, styles, and flavors. That makes nutrition labels difficult to compare at a glance: one product may list nutrients for a 60g serving, while another lists them for 120g or more.
A useful way to make comparisons fairer is to put nutrition values on the same basis: per 100 grams. NoodleIndex includes a feature that converts nutrition information to a common 100g basis, so you can compare products without manually doing the math.
We reviewed the nutrition data provided for this analysis to calculate average and median values per 100g. Here is what the current dataset suggests—and how to use these numbers when choosing instant ramen.
At a Glance: Average Nutrition per 100g
The table below summarizes the NoodleIndex nutrition records supplied for this analysis. Values are normalized using each record's listed serving weight.
| Nutrient | Average per 100g | Median per 100g |
|---|---|---|
| Calories | 383 kcal | 417 kcal |
| Sodium | About 1,426mg | About 1,444mg |
| Total fat | 12.5g | 13.7g |
| Saturated fat | 5.6g | 6.7g |
| Carbohydrates | 58.6g | 62.8g |
| Protein | 9.4g | 9.0g |
| Total sugars | 4.8g | 4.3g |
| Dietary fiber | 2.9g | 2.5g |
| Added sugars | 2.8g | 2.0g |
Dataset note: The uploaded dataset contains 583 nutrition records. Two records with unusually high calorie values per 100g were excluded from the summary calculations pending verification. For sodium, three records with a value of zero were excluded from the average and median because those entries may need verification. Nutrients with missing values were summarized using records where that nutrient was available. Values are rounded and may change as NoodleIndex data is updated.
Why Look at Both the Average and the Median?
The average adds up the values and divides by the number of records. It is useful for describing the dataset overall, but unusually high or low entries can pull it away from what is typical.
The median is the middle value when records are ordered from lowest to highest. It is less affected by extreme values and can help describe a more typical product in the dataset.
For example, the average calorie value in this dataset is about 383 kcal per 100g, while the median is about 417 kcal. The difference is a reminder that a single average does not tell the whole story. Data quality checks and the distribution of values matter, too.
How to Interpret Calories per 100g
In this dataset, the average is about 383 calories per 100g, and the median is about 417 calories per 100g.
Calories per 100g help compare products of different sizes on a common weight basis. But they do not tell you how many calories you will consume from the package you actually eat.
- Calories per 100g help compare the energy content of equal weights of different products.
- Calories per serving tell you the amount listed for the label's serving size.
- Calories per package help you understand the total if you eat the entire package.
A smaller cup may contain fewer calories per package simply because it contains less food. Compare per-100g values to understand the difference by weight, then check serving size and package totals to understand the amount you plan to eat.
Sodium: A Number Worth Checking
The average sodium value in the dataset is about 1,426mg per 100g, and the median is about 1,444mg per 100g.
For context, the U.S. Food and Drug Administration uses 2,300mg as the Daily Value for sodium on nutrition labels. The dataset's average per 100g is roughly 62% of that Daily Value. This is a general label reference, not an individualized target.
Remember that 100g is a comparison unit—not necessarily the amount you eat. To estimate sodium for your portion, check the product's serving size and the number of servings you consume.
Also check whether the nutrition information includes the noodles and all seasoning or soup components. Using only part of a seasoning packet or leaving broth behind may change the amount consumed, but the difference varies by product and preparation.
What About Fat, Carbohydrates, and Protein?
The average values per 100g in this dataset are about 12.5g of total fat, 5.6g of saturated fat, 58.6g of carbohydrates, and 9.4g of protein.
These figures provide a broad overview, but they should not be treated as a score or a ranking of which ramen is “best.” Different people have different preferences and nutritional needs. Looking at several values together gives a more useful picture than focusing on one nutrient alone.
Fiber and sugars can also help you understand differences between products. In the supplied records, average dietary fiber is about 2.9g per 100g, while average total sugars are about 4.8g per 100g. Nutrition fields may be missing or recorded differently across products, so comparisons are most reliable when the underlying labels are complete and consistent.
Compare Products with NoodleIndex's Per-100g Feature
You do not have to calculate nutrition values by hand. NoodleIndex includes a feature that converts product nutrition information to a common 100g basis, making it easier to compare products with different package sizes and serving amounts.
- Browse the instant ramen products on NoodleIndex.
- Use the per-100g comparison feature to compare nutrition values on the same basis.
- Look at calories, sodium, fat, carbohydrates, protein, and other available nutrients.
- Before deciding, check the original serving size and the nutrition for the amount you intend to eat.
Explore instant ramen on NoodleIndex and use the per-100g comparison feature to make a more informed choice.
What These Statistics Can—and Cannot—Tell You
These statistics describe the nutrition records supplied for this analysis; they are not a universal statement about every instant ramen product on the market. The results depend on which products are included, whether nutrition fields are complete, and whether serving weights and label values are recorded consistently.
Before using these averages as a long-term benchmark, NoodleIndex should continue reviewing unusual values, missing fields, and differences in how package weights and servings are recorded. As the database grows and is updated, the statistics may change.
The Bottom Line
Comparing instant ramen is easier when every product is measured on the same basis. In the current NoodleIndex dataset, the average is about 383 calories and 1,426mg of sodium per 100g, after the data checks described above. The median can add useful context, and other nutrients help round out the comparison.
Use per-100g values to compare products fairly, then check the serving size and package totals for the amount you actually plan to eat.
Visit NoodleIndex to explore products and compare available nutrition information using the per-100g feature.
Nutrition information may change when manufacturers update recipes or packaging. Always check the current product label, especially for allergens and dietary needs. This article is for general informational purposes and is not individualized medical advice.